You have already read the first 6 parts of the Facebook for Small Business series, right? Now it's time to talk about analytics. If you need to do some catching up, here are the first 6 parts to the series.
Part 3 – Getting Likes The Easy Way (some low hanging fruit for getting likes)
Part 4 – It’s about more than just the Wall! Custom Tabs are a must.
Part 5 – A Case Study On Ace Hardware’s Use of Facebook
Part 6 - A Case Study on the Belgium Brewing Company's Use of Facebook
You are able to track your referrals from most analytics packages. A referring site is one that links to your site and the user of that site clicks the link and lands on yours. Once they are on your site you have all sorts of data about what they do. Are they signing up for your newsletter, buying a product, spending X amount of time on site, etc. This is all wonderful data, but there is more to it than Google Analytics. Yes, I said it. If you follow my posts you are probably aware that I am a Google Analytics fanatic, but I am a firm believer that your web marketing efforts will be more successful with the more data that you have. So here it goes...
While I think there are still some lacking areas, Facebook Insights has improved greatly in recent months. The best part is, they are generally very easy to understand. To get the Insights data you must be an administrator of a Facebook Page. Have you set up your Facebook business page correctly? Insights are currently only available to Pages...so if you have set it up correctly and/or are an admin of a page, go to www.Facebook.com/Insights. You should see your business page granted you are logged into your account. Still don't see it? Something is wrong, either you have not set up your business page as an actual "page", you are not an admin of a page, or your page was very recently created and there are no insights available yet. Currently Facebook Insights does not offer real-time statistics. They currently trend about 4 days behind.
Another easy way to access your insights is to navigate to your page, look to the left, and scroll down slightly. You should see something similar to the left box.
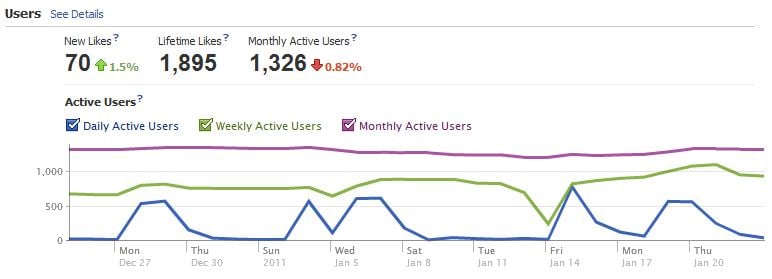
The users data helps you understand a little bit about the Facebook users that "Like" your page. Keep in mind, these may or may not be people that are your Facebook friends, these are people that chose to like your page.
This chart shows you an overview of your likes and active users. The data will default to the last month, but you can adjust to a week view or even choose a custom date range. As with all reports you can also download this data to manipulate and view in Excel or as a comma separated value (csv) file.
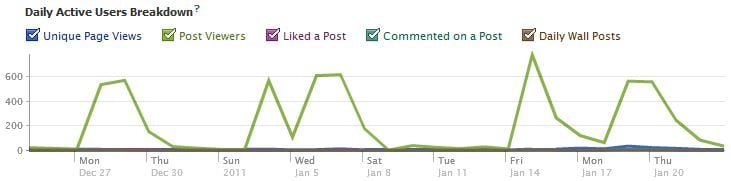
But let's dig deeper to understand a little bit more about your users. Click on the see details link. From this view you see a little bit more about your user interaction. You can easily toggle to show the data or not, for example:
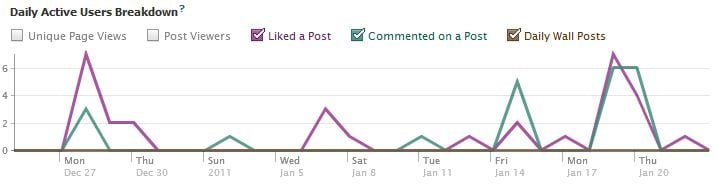
By un-clicking the unique pageviews and post viewers option, I can see more data about which days people liked my posts or commented. You can now look back and see what you posted on certain days, who interacted with the post, and how everything was handled on your end.
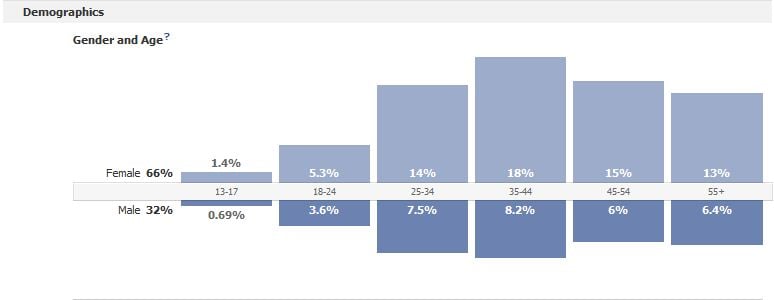
I think that we can all agree that the more we know about our audience, the easier it is to market to them. Facebook helps us out here. You can see demographic information about your users. You can obviously make guesses about your demographics, but now you have some solid data. If the users that actually like you through Facebook are your target customers, take a look at the data provided.
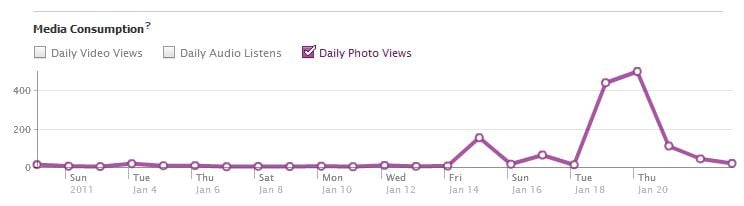
Facebook is also nice enough to provide you data on what people actually do when they are on your page. Are the same users returning over and over, or are most of your users unique? When you post media to your page, how many users watch videos, listen to audio or check out the pictures. This gives you some really great data into what people like. Any media consumption spikes will likely show you the things that your audience is actually interested in.
In the interactions section you can also see which external sources referred visitors to your tab. You may see that some of the external sources are your own site or other people you are familiar with, but you may also find out that there are some unsuspecting referrers out there. It is probably a good idea to see how that referrer got their users to visit your Facebook page. Are they saying something negative or positive about you? If a spike occurs one day the referrals dropped a couple of days later, what caused the external site to post a link to your page? Were you running a new promotion? Did you make the local news? All of this is data that you should pay attention to.
While I think that data from the analytics on your actual website is more important, at least you can understand what's happening through your Facebook efforts. You may be able to use the data that you obtain for future marketing efforts. I will come back to the thought that web marketing is a data driven marketing landscape. The more you know about your efforts, the more successful you will be in the future.